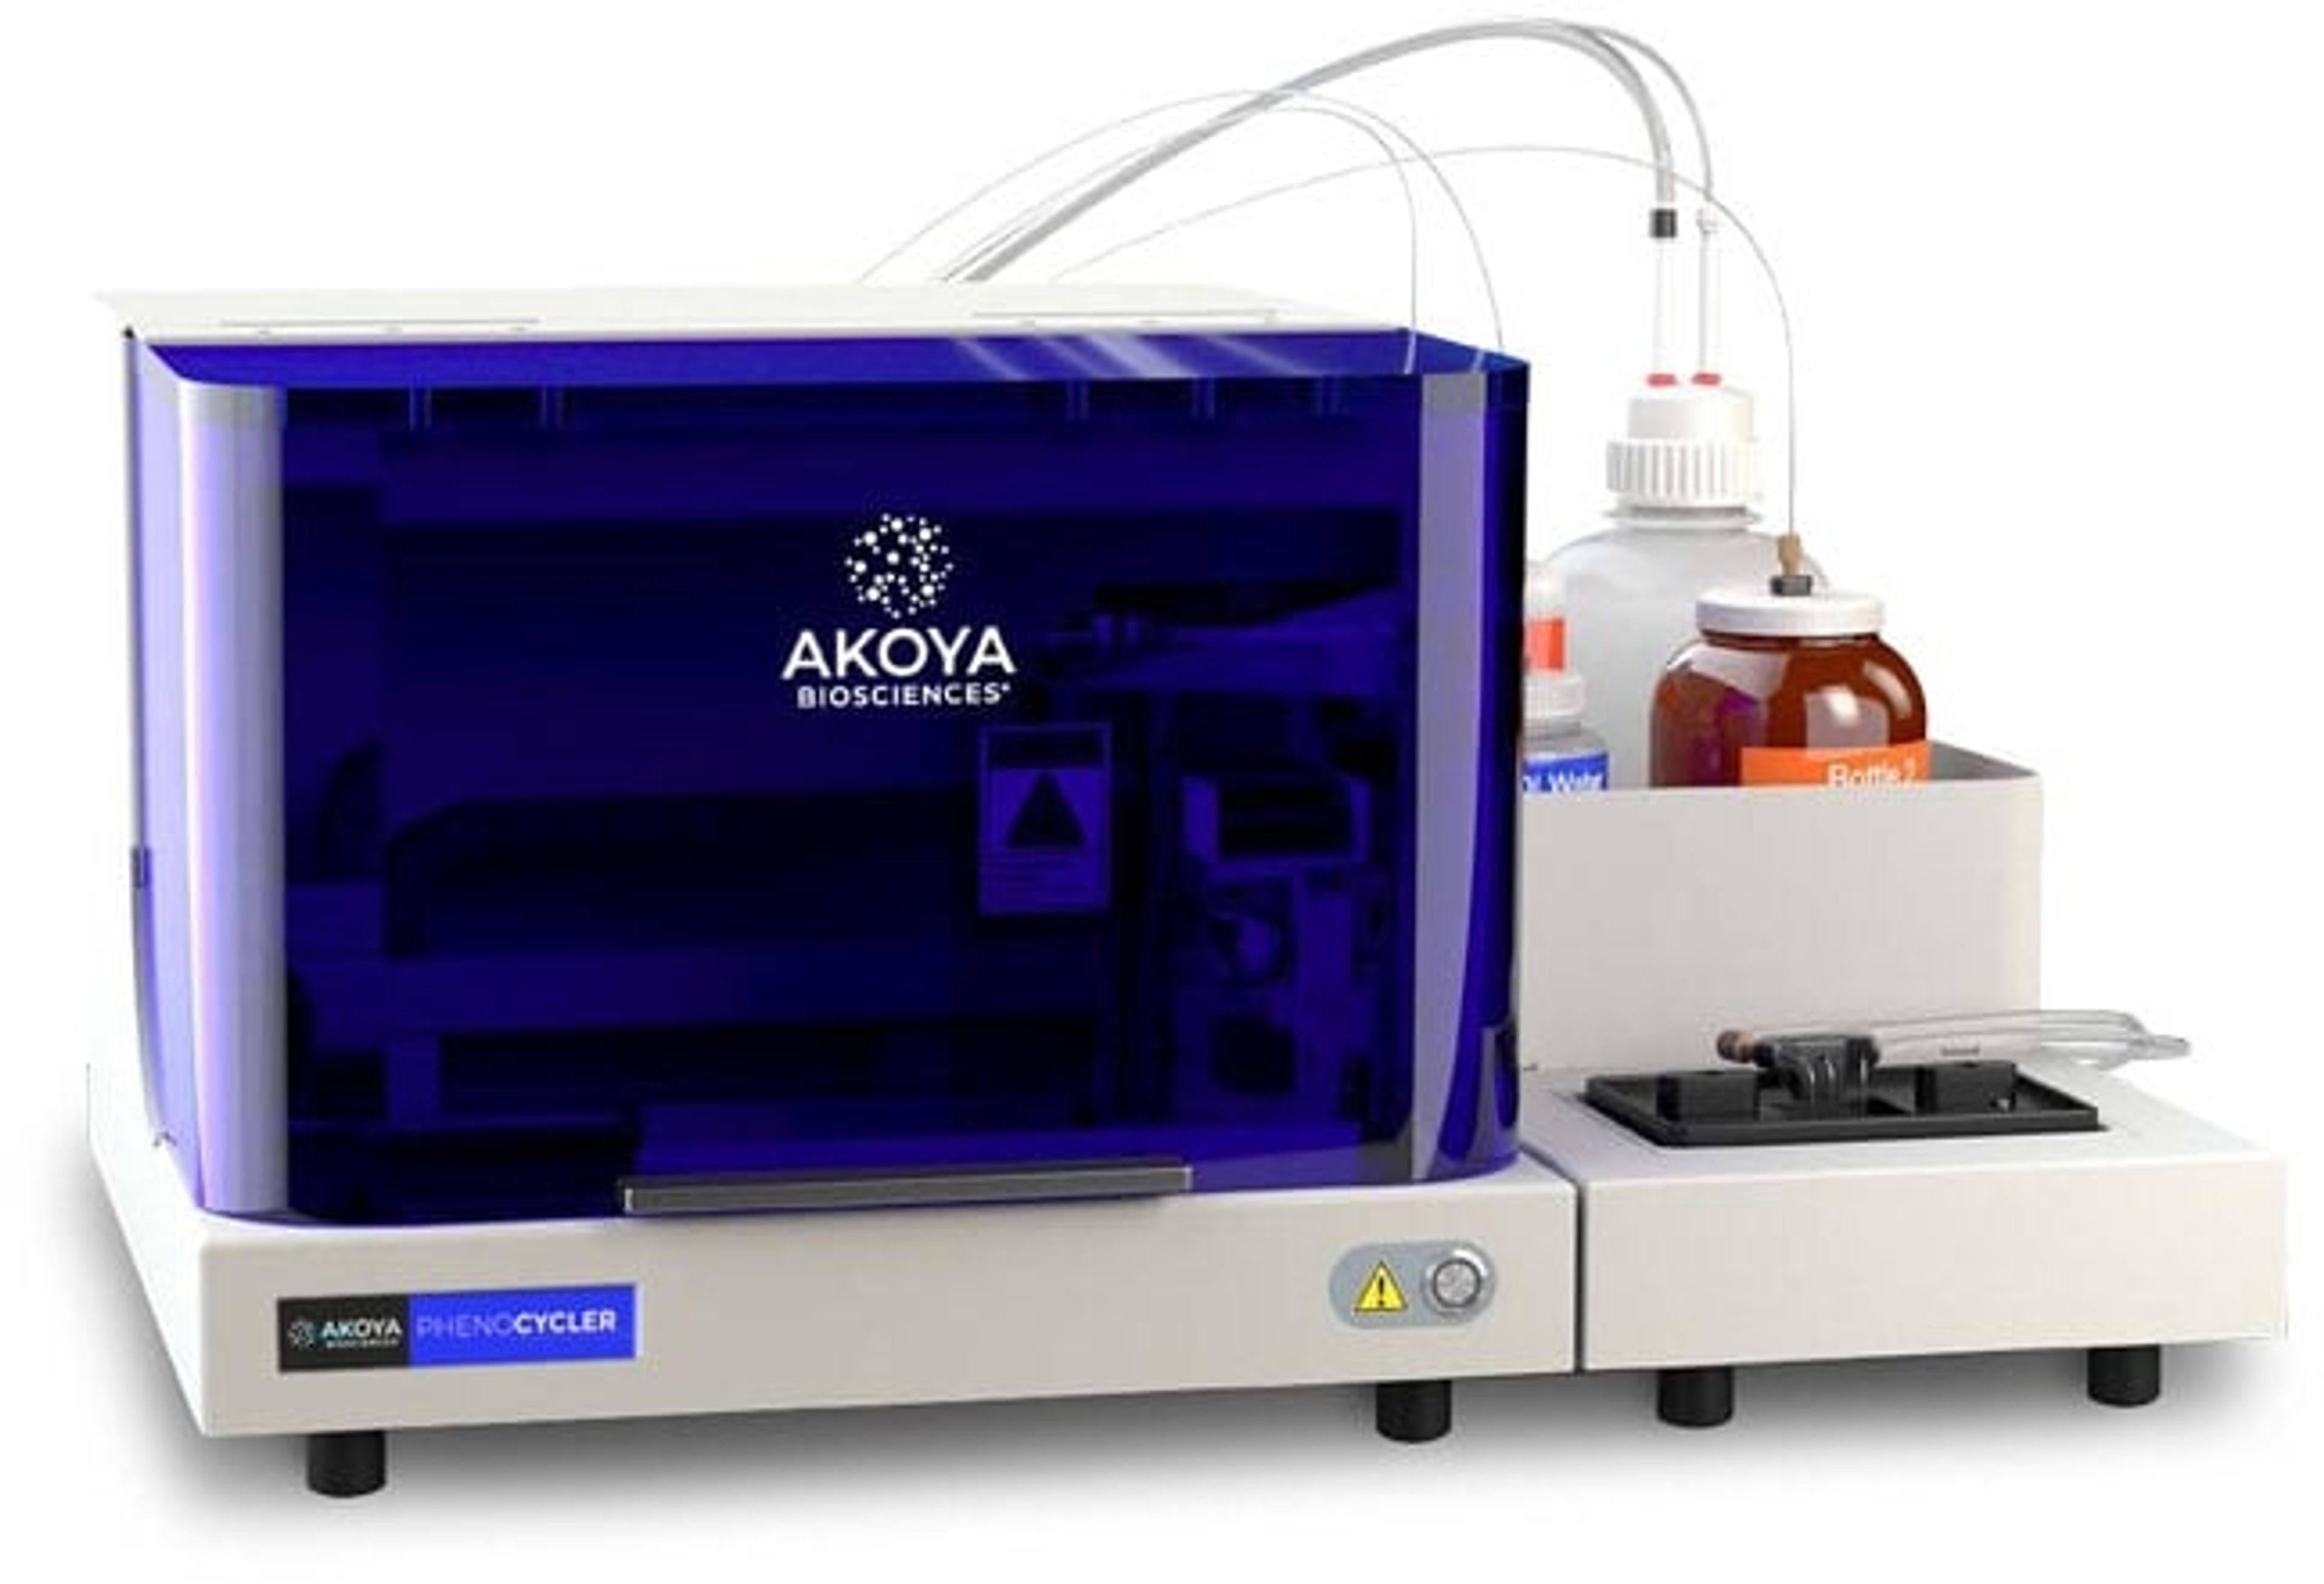
PhenoCycler®
Akoya BiosciencesThe PhenoCycler ® is a cutting-edge fluidics control unit that integrates with the PhenoImager Fusion imaging platform creating the fastest spatial biology solution with unparalleled throughput.
Showing 12 products from Akoya Biosciences in Clinical Diagnostics
The PhenoCycler ® is a cutting-edge fluidics control unit that integrates with the PhenoImager Fusion imaging platform creating the fastest spatial biology solution with unparalleled throughput.
PhenoImager ® HT (formerly Vectra ® Polaris™) is the fastest and most highly cited whole-slide, single-cell resolution imaging platform for spatial phenotyping and the development of spatial signatures. Featuring Akoya’s patented Multispectral Imaging (MSI) and spectral unmixing technologies, this platform can be easily integrated into high-throughput workflows to accommodate projects regardless of your scale.
PhenoCycler ® -Fusion 2.0 is the fastest solution for spatial biology researchers who need to achieve the quickest route to results. Trusted by top academic and industry leaders, this next-generation platform sets the pace for groundbreaking spatial discoveries.

The PhenoImager ® ; Fusion system is a whole-slide, single-cell resolution, ultrafast multispectral imager ideal for standard throughput brightfield and fluorescence imaging applications. This imaging platform can be integrated with the PhenoCycler ® ; system (formerly CODEX ® ) for ultra high-plex spatial discovery at scale.
inForm® Tissue Finder™ adds exceptional functionality to inForm Cell Analysis to automate the detection and segmentation of specific tissues through powerful patented pattern recognition algorithms. Automation provides consistent reproducible results and enables comparative studies of multiple markers and specimens, supporting researchers to make faster discoveries of the indicators of disease.
Powered by proprietary barcoded antibody technology and leveraging an extensive database of over 350 antibodies, PhenoCycler®-Fusion 2.0 Assays make deep spatial phenotyping easier than ever. Choose from ready-to-use PhenoCode™ Discovery Panels for time-efficient studies or design your own panels to suit your specific research needs.
Opal 6-Plex Detection Kits - for Whole Slide Imaging (formerly Opal Polaris 7 Color IHC Detection Kits)
Tumors characterized as "hot" exhibit signs of inflammation, high T cell infiltration, and expression of PD-L1. These inflamed tumors typically respond well to checkpoint inhibitor immunotherapy. PhenoCode Signature Immuno-Contexture panel (CD8, CD68, PD-L1, FoxP3, PanCK) enables profiling of the tumor microenvironment for CD8+ T lymphocytes and PD-L1 expression. Map additional phenotypes by adding a 6th marker to the panel fr…
The composition of immune cells within the tumor microenvironment, such as T cells, B cells, and macrophages, varies between tumors and is strongly associated with outcomes to combination therapies. PhenoCode Signature Immune Profile panel enables profiling of the tumor microenvironment using 4 key immune cell markers (CD8, CD68, CD3e, CD20) and a tumor marker (PanCK). Map additional phenotypes by adding a 6th marker to the pa…
The ability to determine whether tumor cells are proliferating and T cells are activated could provide important information about the anti-tumor response and be an indicator of prognosis. PhenoCode Signature Activated TIL Status panel (CD8, CD3e, Ki67, Granzyme B, PanCK) enables determination of Ki67 positivity in addition to profiling of the tumor microenvironment for CD8+ T lymphocytes that are activated. Map additional phe…
Tumor associated macrophages (TAMs) play a key role in regulating the inflammatory or immunosuppressive state of the tumor microenvironemnt (TME). Distinguish between M1 (pro-inflammatory) and M2 (anti-inflammatory) TAMs using the PhenoCode™ Signature M1/M2 Polarization panel (CD8, CD68, CD163, PD-1, PD-L1) to evaluate polarization profiles in the TME. Map additional phenotypes by adding a 6th marker to the panel from the anti…
As the major population of immune cells within the tumor microenvironment (TME), T cells are a driver of anti-tumor immunity. T cell exhaustion and the presence of immunosuppressive cells can contribute to an immunosuppressive TME. PhenoCode™ Signature T Cell Status Panel (CD8, CD4, CD20, FoxP3, PD-1) allows for identification of distinct T Cell subsets and effector functionality status. Map additional phenotypes by adding a 6…